Multivariate: fPCA
Import libraries
[1]:
import numpy as np
import xarray as xr
import matplotlib.pyplot as plt
import synthia as syn
import pyvinecopulib as pv
from multiprocessing import cpu_count
Define plotting function
[2]:
def plot_profiles(ds, var_name, n_profiles=100):
    _, ax = plt.subplots(figsize=(6, 4))
    for column in np.random.choice(ds.column, n_profiles):
        ds[var_name].sel(column=column).plot(ax=ax, c='#332288', alpha=0.15)
    ax.set_ylabel('Air temperature in K')
    ax.set_xlabel('Atmospheric level')
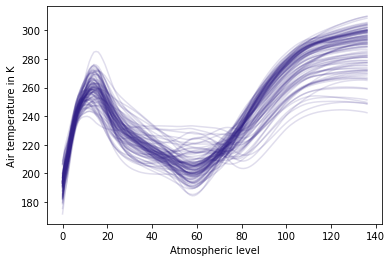
Plot source data
[3]:
ds_true = syn.util.load_dataset(name='SAF-Synthetic')
plot_profiles(ds_true, 'temperature_fl')
Fit the fPCA model using 10 components
[4]:
generator = syn.FPCADataGenerator()
generator.fit(ds_true, n_fpca_components=10)
Generate same number of samples as in the input
[5]:
N_SAMPLES = 100
ds_synth = generator.generate(n_samples=N_SAMPLES)
ds_synth
[5]:
<xarray.Dataset>
Dimensions:         (column: 100, level: 137)
Dimensions without coordinates: column, level
Data variables:
    temperature_fl  (column, level) float32 176.6 188.8 198.1 ... 300.8 301.1
xarray.Dataset
- column: 100
- level: 137
- temperature_fl(column, level)float32176.6 188.8 198.1 ... 300.8 301.1
array([[176.56955, 188.78862, 198.07573, ..., 290.81512, 290.90454,
        290.9896 ],
       [182.10274, 194.09053, 202.79999, ..., 297.95544, 298.18604,
        298.4139 ],
       [188.12065, 202.25777, 210.42616, ..., 261.82138, 261.7511 ,
        261.59152],
       ...,
       [191.89088, 203.00899, 209.90767, ..., 279.4663 , 279.54303,
        279.57245],
       [193.04372, 203.41103, 210.10536, ..., 286.67508, 286.7693 ,
        286.8223 ],
       [197.26312, 206.85098, 213.5597 , ..., 300.5537 , 300.80475,
        301.06342]], dtype=float32)
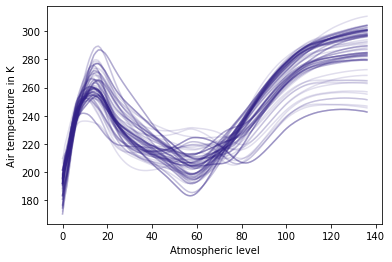
Plot the results
[6]:
plot_profiles(ds_synth, 'temperature_fl')
[ ]: